You felt it all month. Now see what your hormones were doing.
Your Oova Health Report turns daily at-home hormone tests into one clear picture: when you ovulated, how long each phase lasted, how your symptoms lined up, and where you are in the reproductive transition.
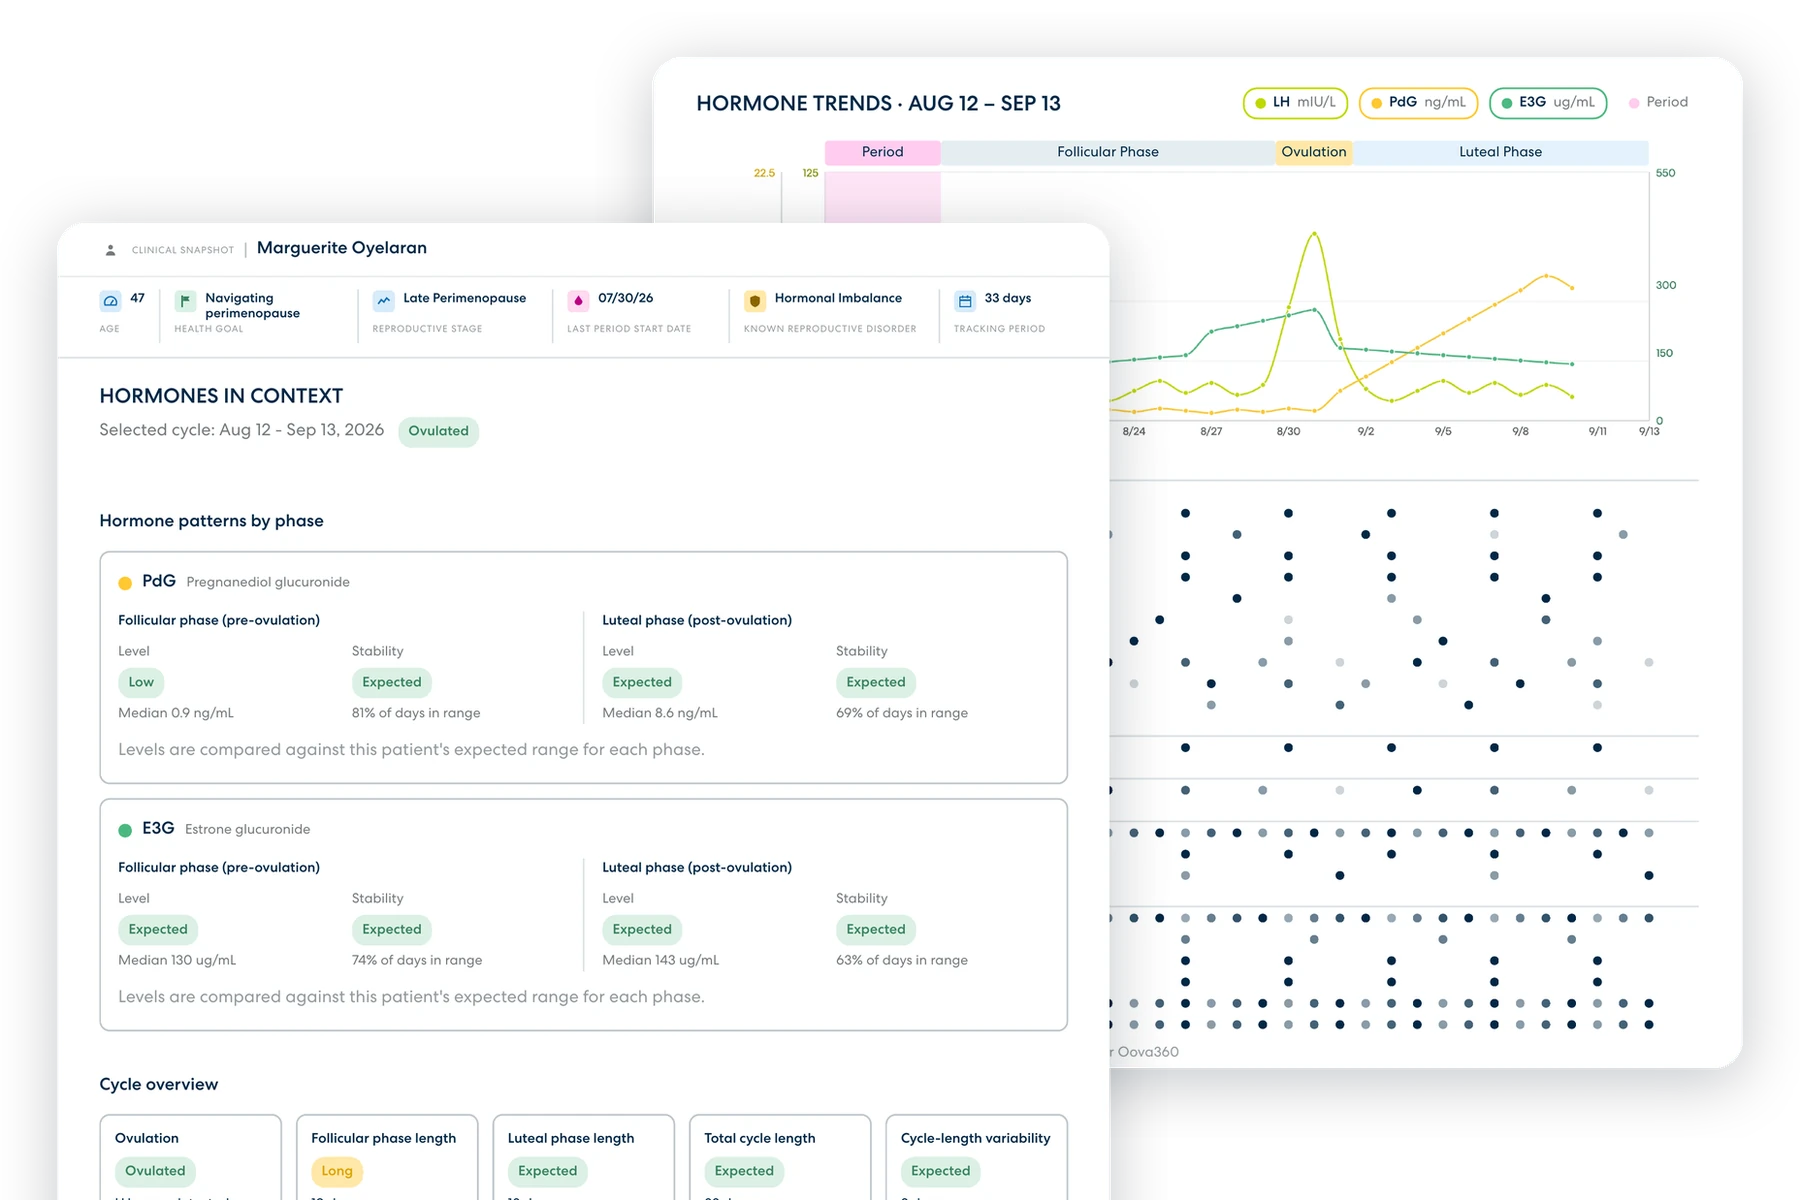
Your whole cycle on one page.
Not just whether you ovulated. How your hormones measured up against what’s expected for each phase of your own cycle.
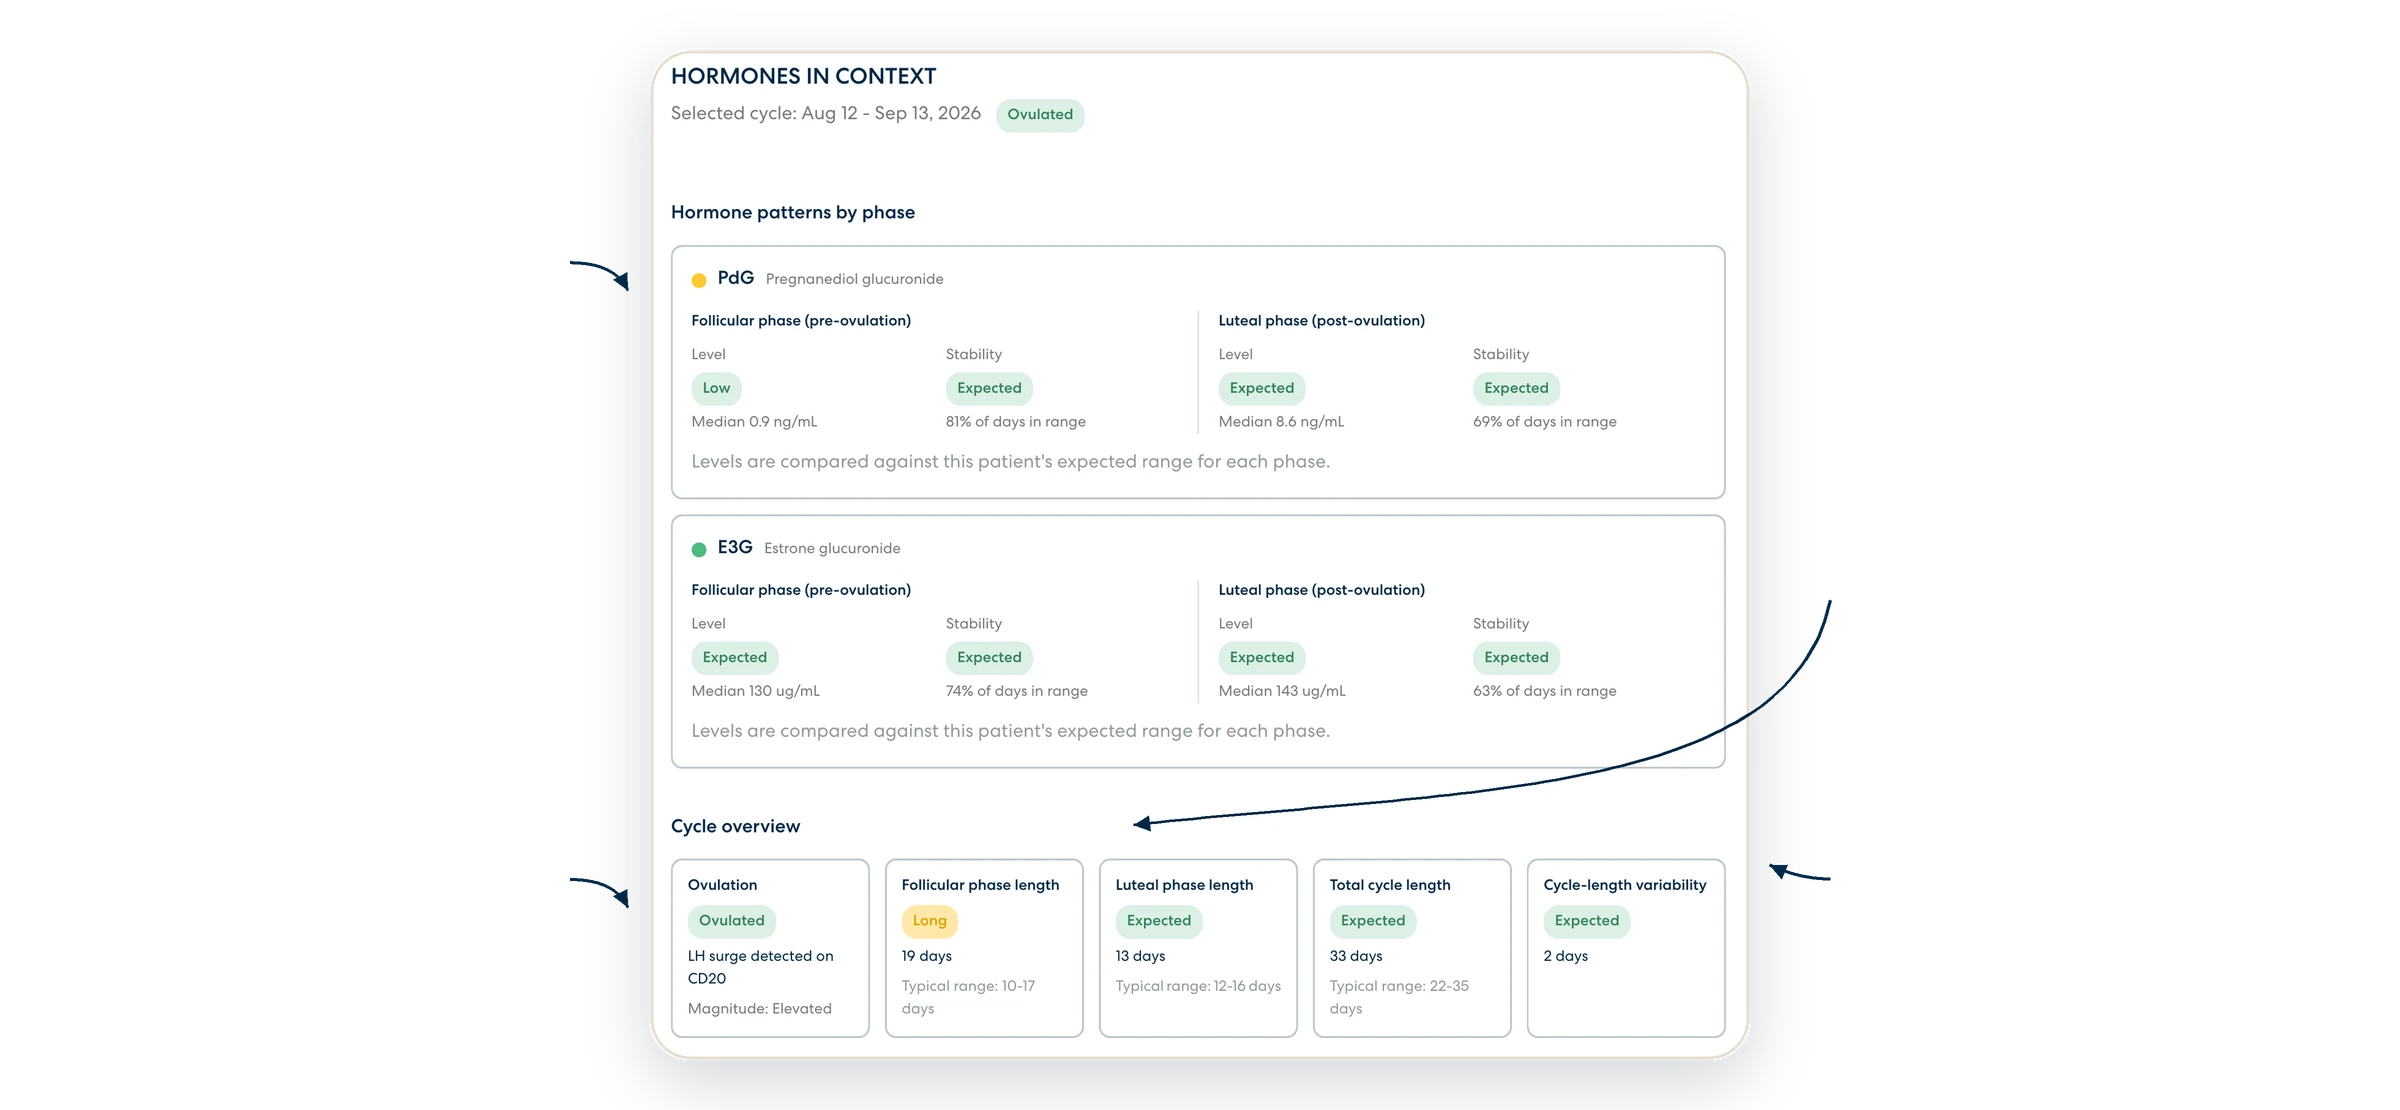
Your progesterone and estrogen levels compared with the expected range for each phase.
Whether you ovulated, the cycle day your LH surged, and how strong the surge was.
Follicular and luteal phases tracked separately, so a normal-looking cycle can’t hide a short phase.
How much your cycle shifts month to month, one of the markers clinicians use to stage perimenopause.
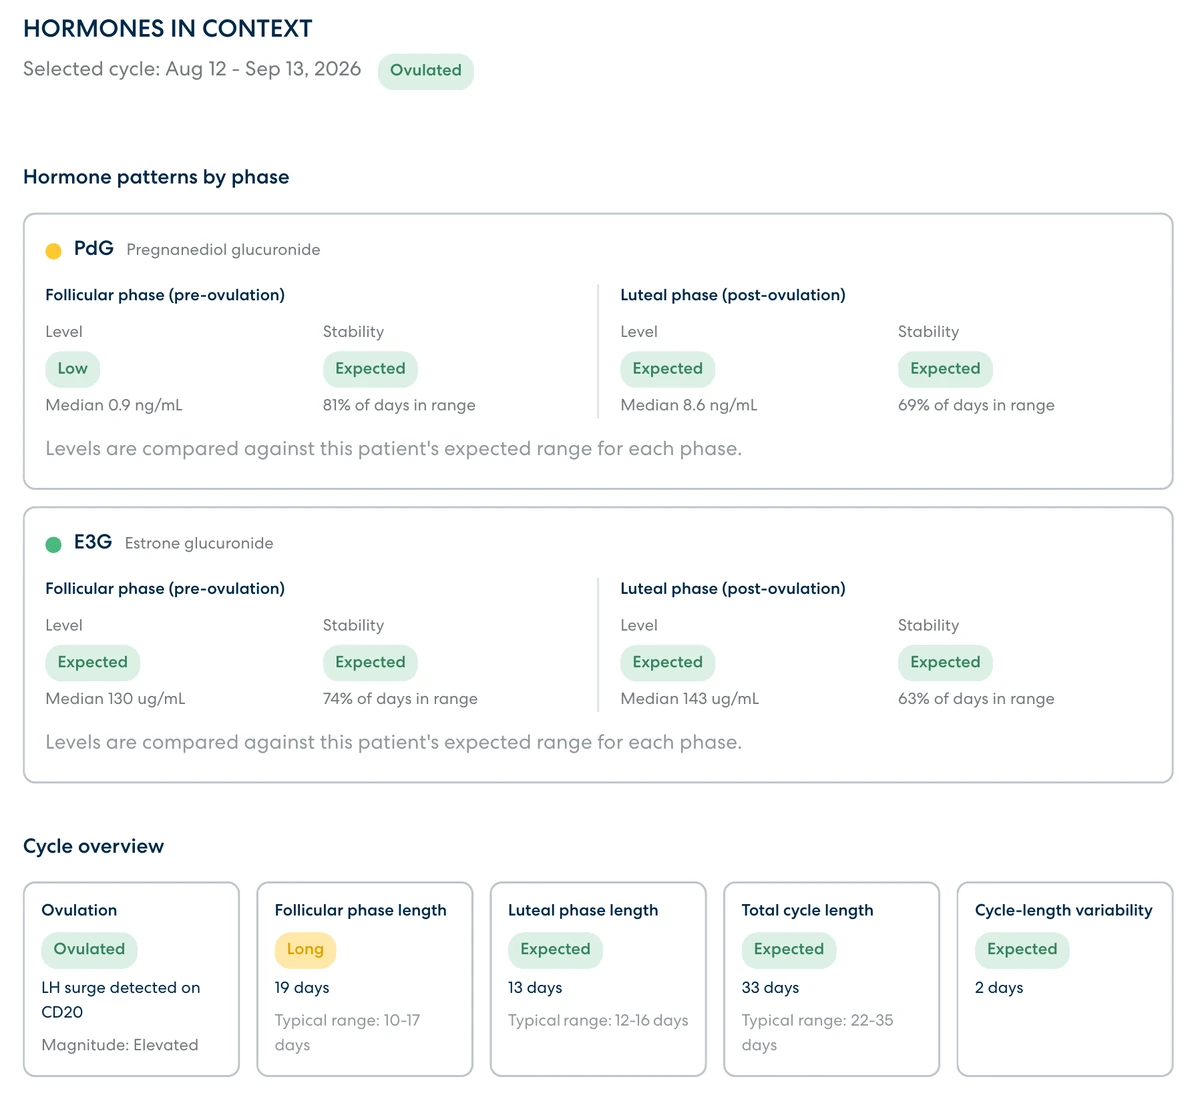
Your progesterone and estrogen levels compared with the expected range for each phase.
Whether you ovulated, the cycle day your LH surged, and how strong the surge was.
Follicular and luteal phases tracked separately, so a normal-looking cycle can’t hide a short phase.
How much your cycle shifts month to month, one of the markers clinicians use to stage perimenopause.
Line up how you felt with what your hormones did.
Your daily hormone curves sit right above the symptoms you logged. So if the headaches, bad nights or hot flashes cluster around one phase, you’ll see it.
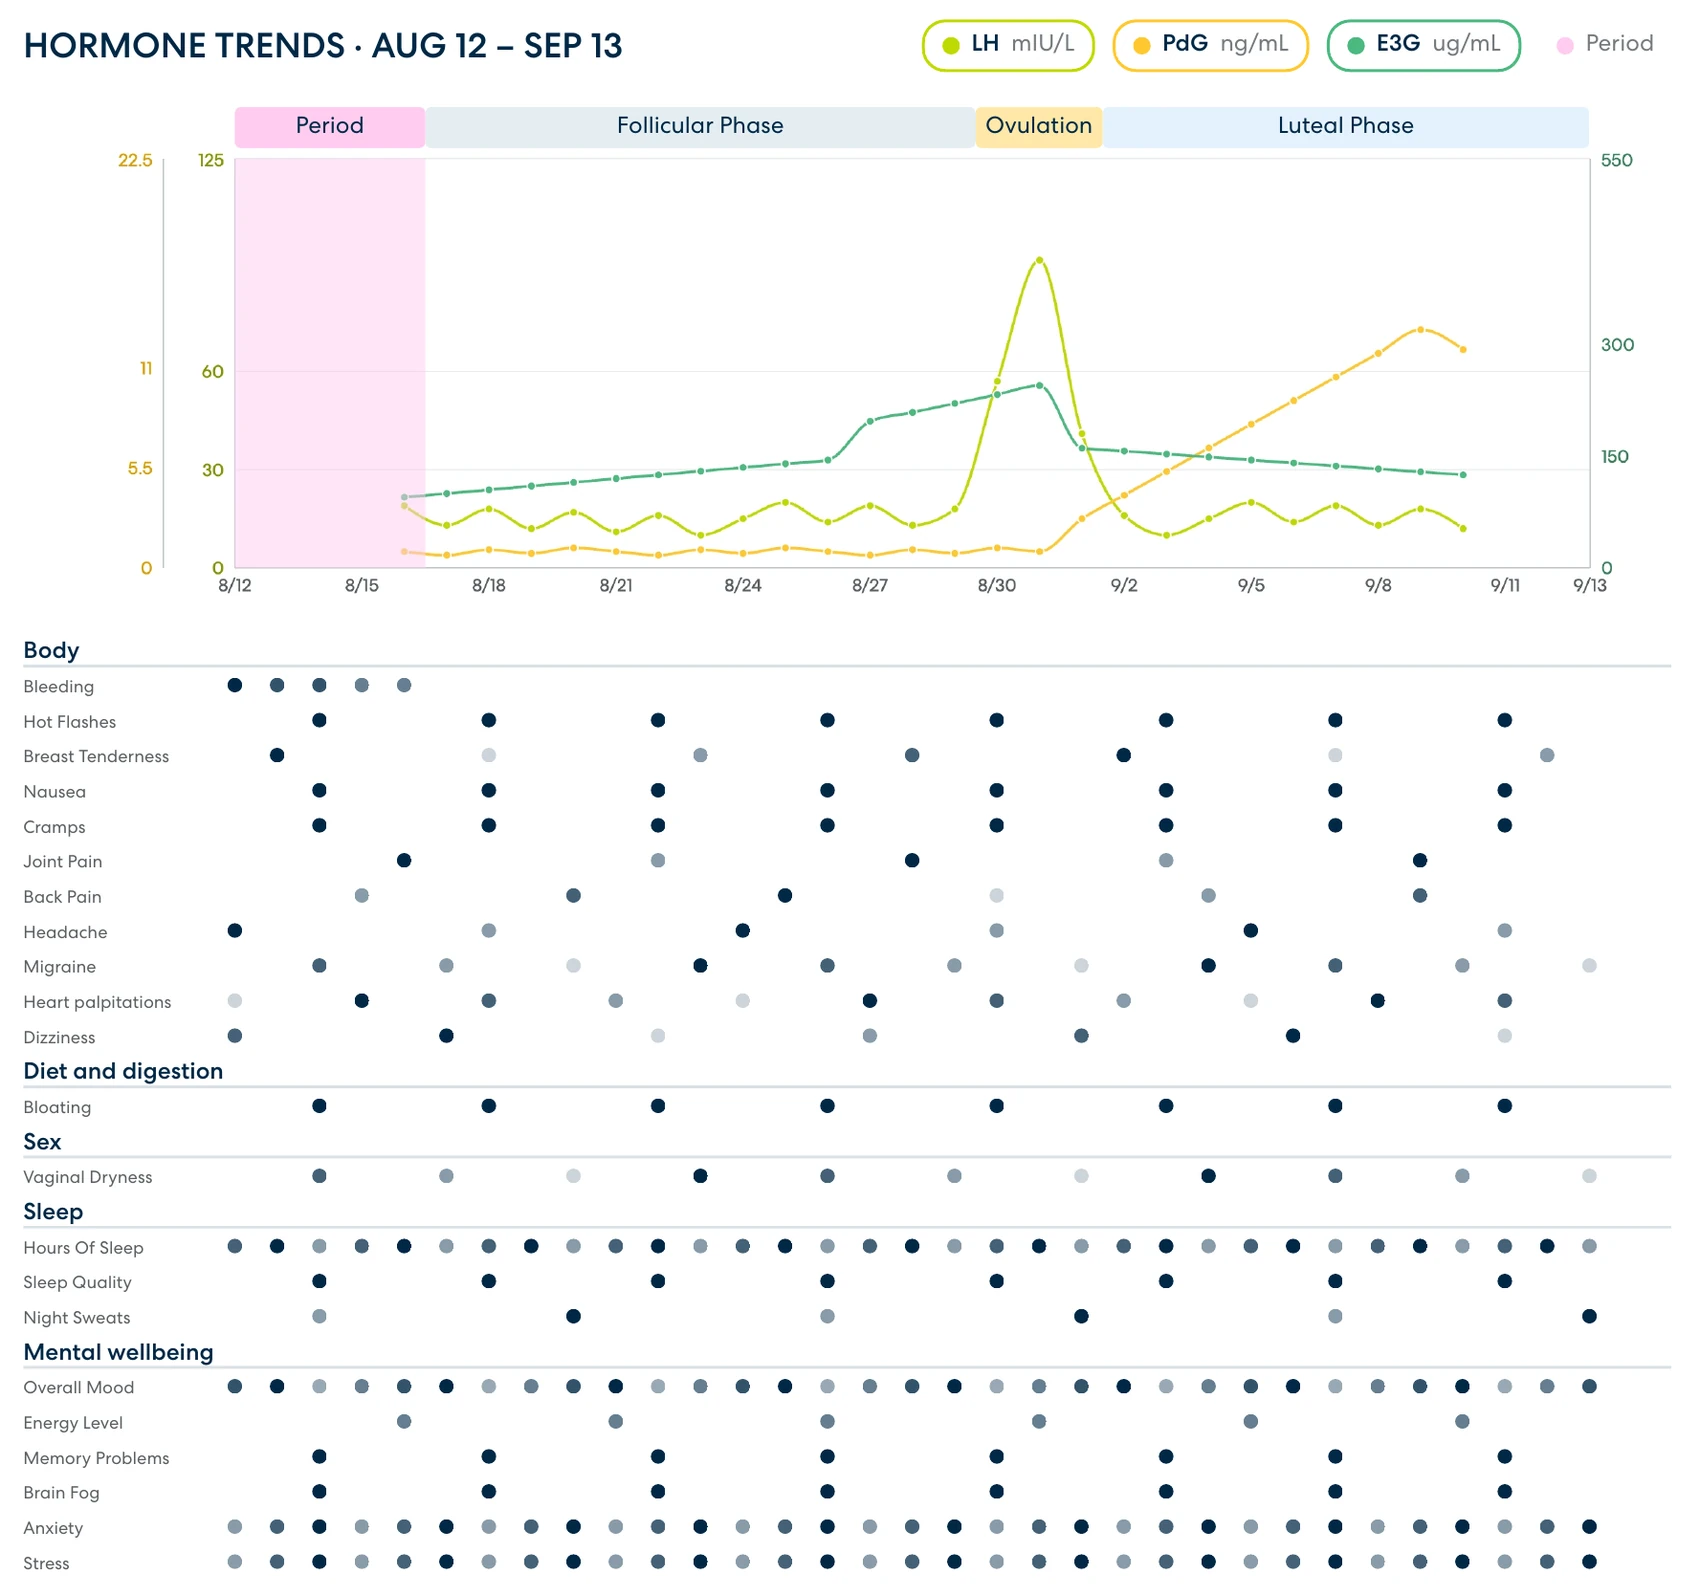
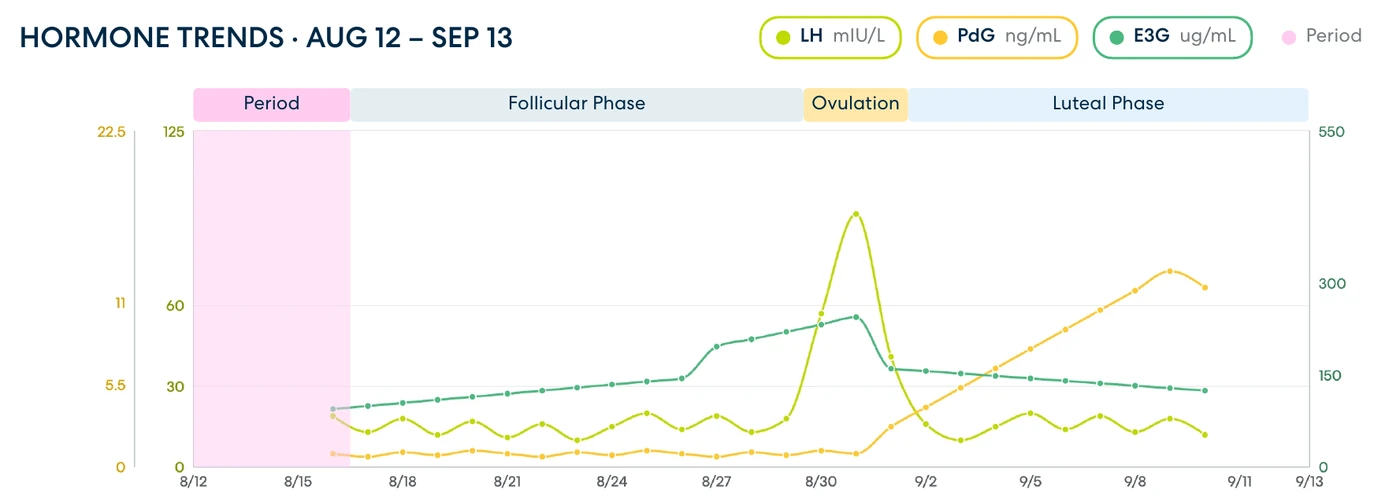
LH, PdG and E3G across your period, follicular, ovulation and luteal phases.
Sleep, hot flashes, headaches, mood, energy, brain fog and more, day by day.
One test is a moment. A month of daily tests shows the shape of your cycle.
A name for what’s been happening.
Hormones shift differently from one person to the next. Oova looks across your daily data, matches it to a hormone pattern, and explains what that pattern tends to feel like.
The Roller Coaster is one of several patterns your report can identify.
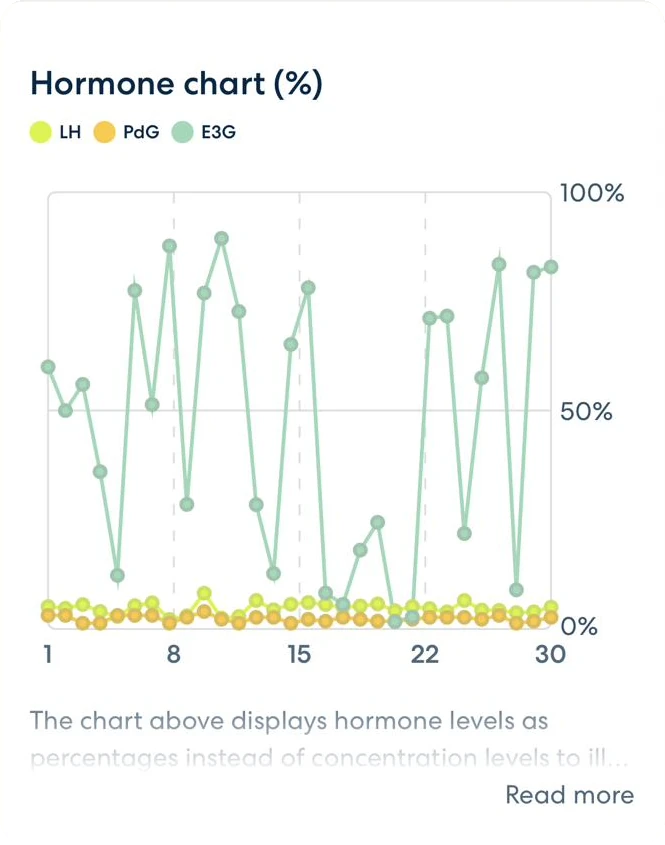
Your report includes specific questions to bring to your next appointment, plus lifestyle steps that may help.
Know where you are in the transition.
Using your cycle patterns over time, your report estimates your reproductive stage and what’s likely to change next.
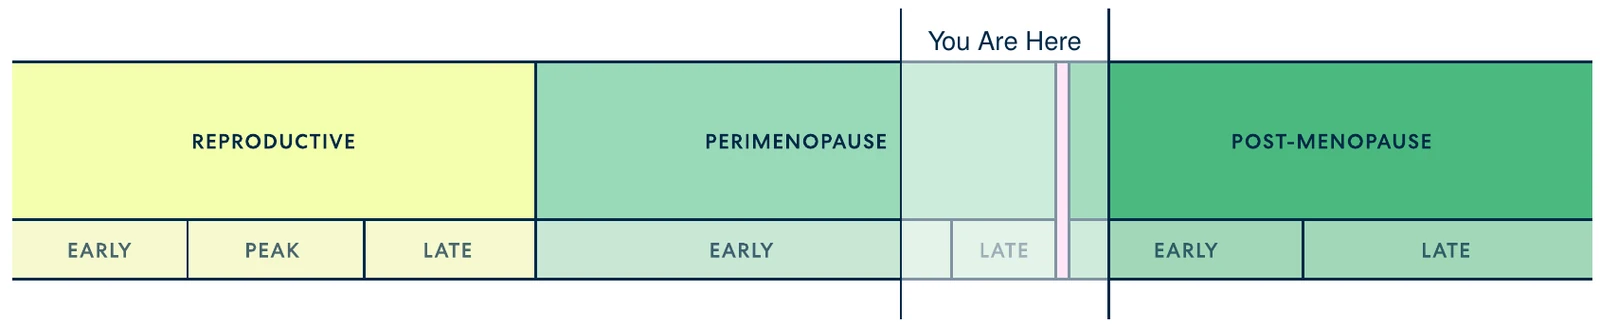
Skipped or irregular periods, heavier bleeding, and luteal phases that may shorten.
Hot flashes, brain fog, mood swings and joint aches, plus how long this stage may last (often 1–3 years).
From simple steps for sleep and hot flashes to low-dose hormone therapy to discuss with your provider.
Walk in with data, not just a description.
Every report ends with the numbers behind the insights: exact phase dates, peak hormone levels and every daily reading. It’s built to share, so you and your provider start from the same page.
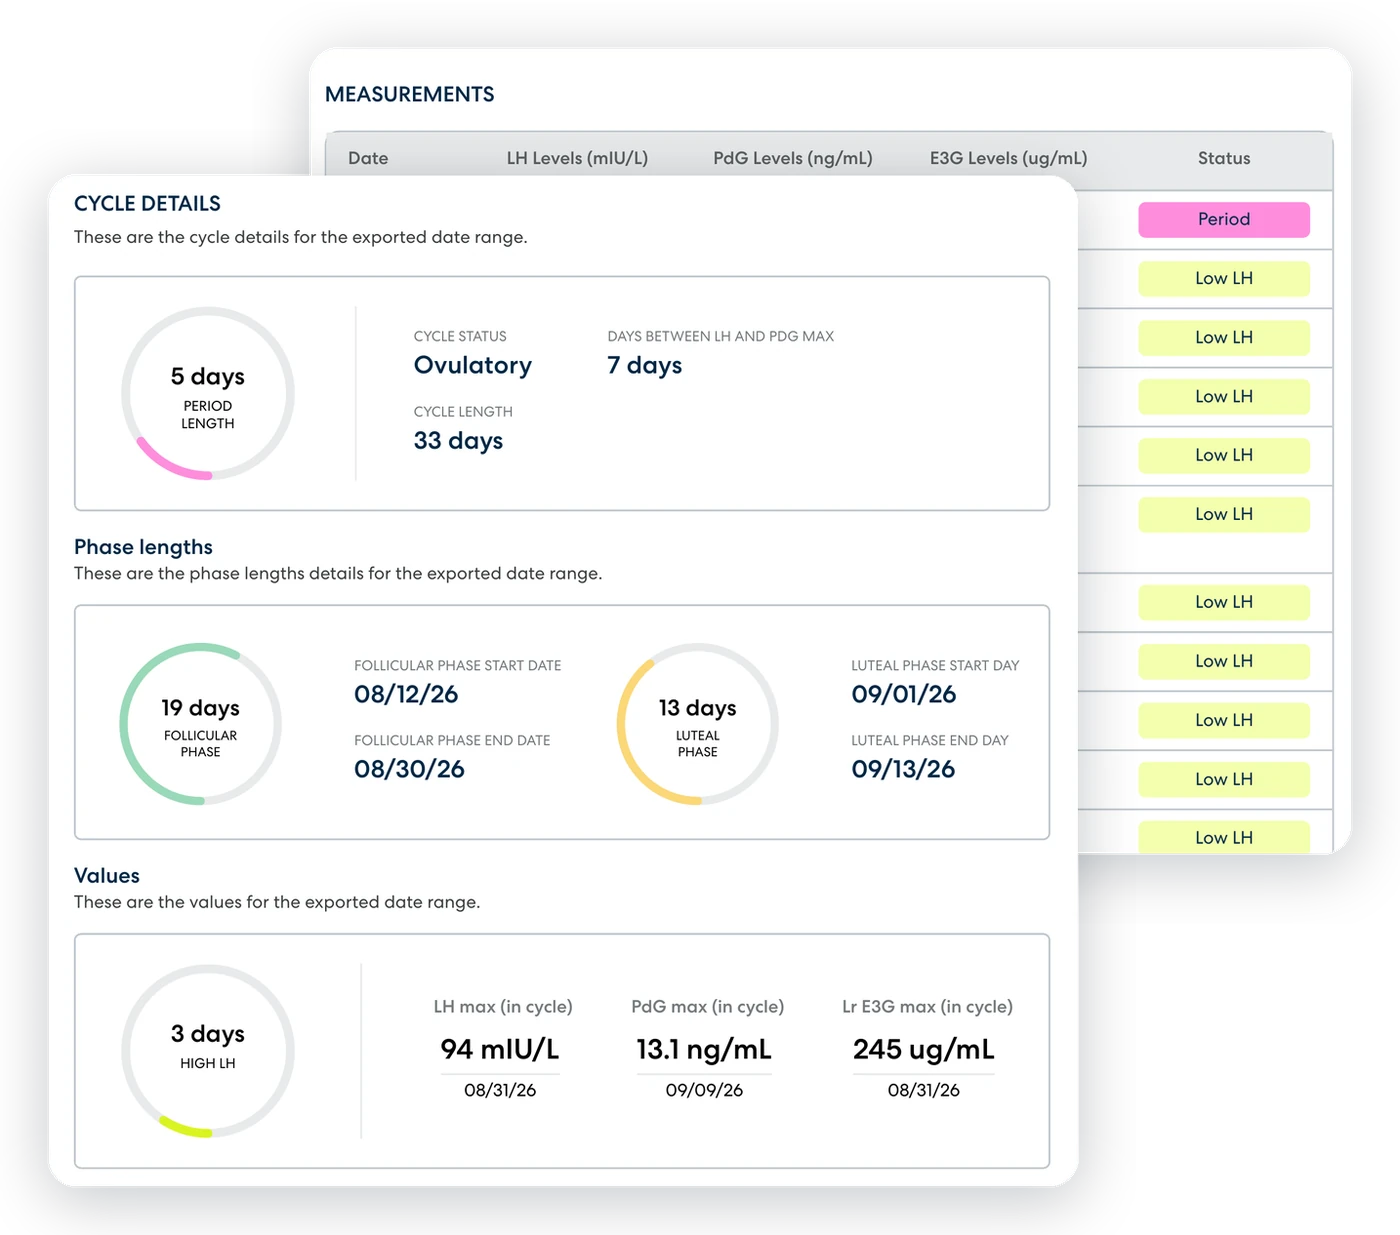
Built on real hormone measurements, not estimates.
The surge that triggers ovulation.
A urine marker of progesterone that shows what happens after ovulation.
A urine marker of estrogen that shows how much your levels rise and fall over time.
Stop guessing what your hormones are doing.
Test at home, log how you feel, and get your own report: ovulation, phases, symptoms and stage, all in one place.